Log and visualize your IoT data
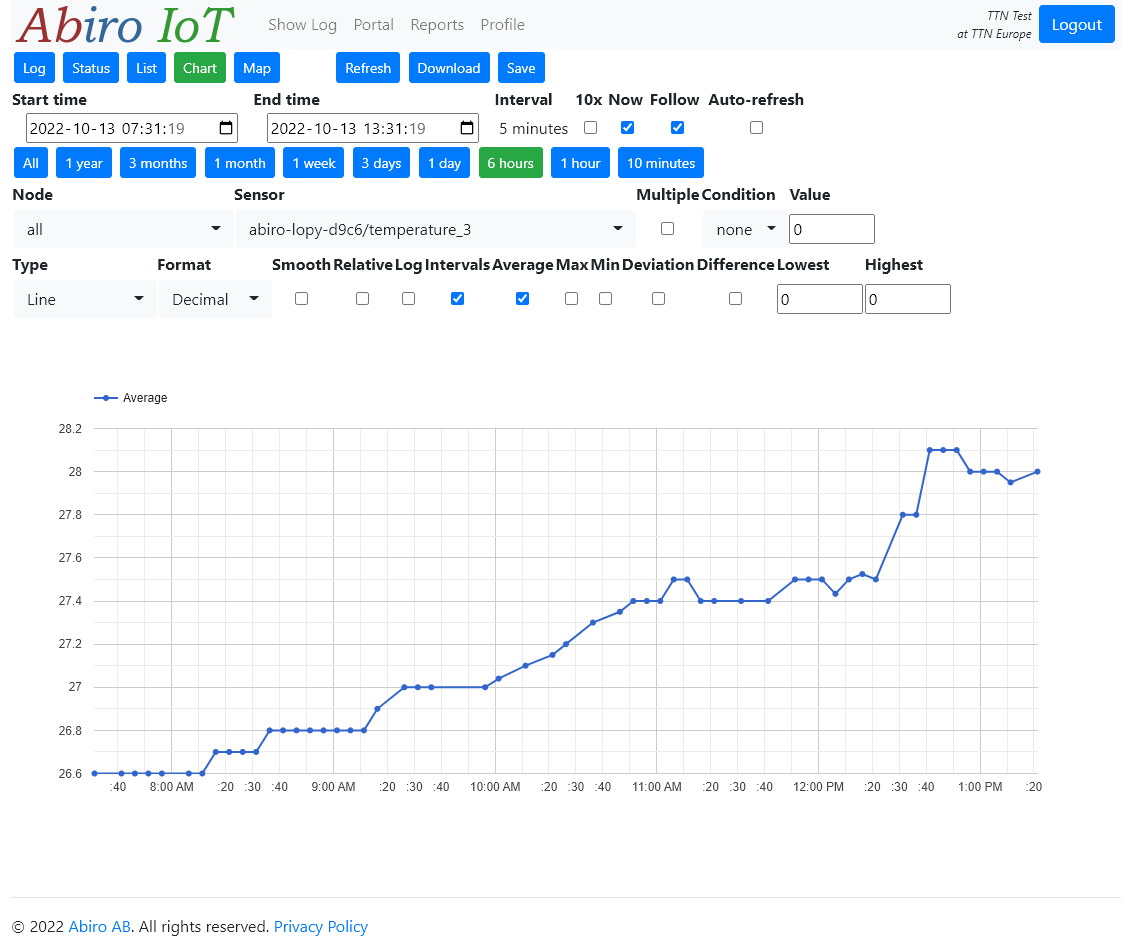
Turn your aggregated IoT data into useful and understandable logs, lists, charts, and maps, filtered on time and sensors.
Select one or more sensors to watch. Follow data over time via automatic log, list, chart, and map updates. Select among pre-defined time windows or choose starting and ending time exactly. Move between visualization modes without losing settings. Download data based on made selections. Access data based on search criteria via API requests.
Abiro IoT is integrated with The Things Network, Sensative Yggio, Microsoft Power BI and Google Data Studio.
Use Microsoft Power BI, Google Data Studio, or your favorite spreadsheet application for further analysis of sensor data, in real-time via a streaming dataset or based on downloads from Abiro IoT.
Abiro provides access for its own and Sensative customers on request. There is no self-service registration at the time being.
End-to-end solution
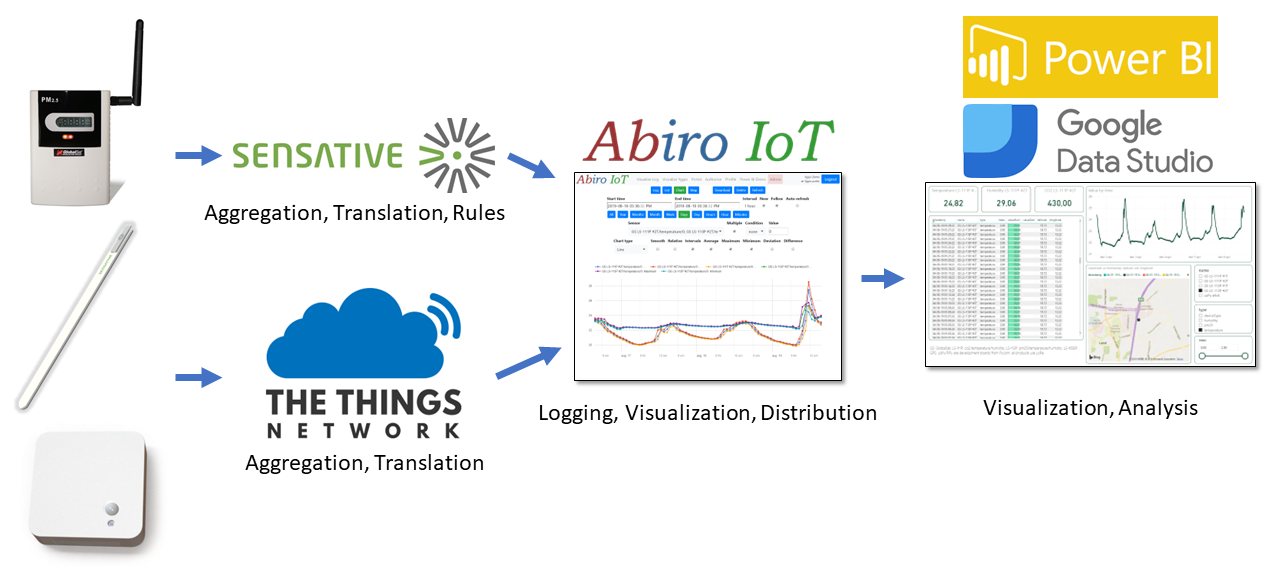
Chart view in Abiro IoT
Presentation
© 2024 Abiro. All rights reserved. Privacy Policy